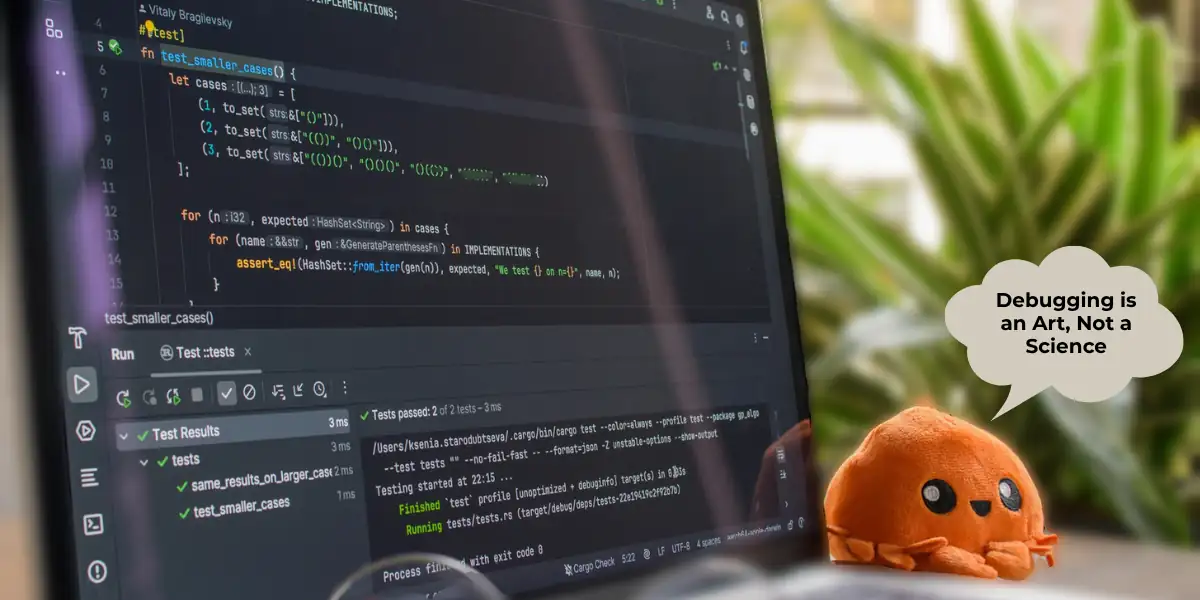
Debugging is an Art, Not a Science
As a web developer, I’ve spent years grappling with bugs that seemed to defy logic. But one particular incident taught me that debugging isn’t just about fixing code—it’s about understanding why things break, and how to rewire the system to work correctly. Let me share that story.
The Problem: A Mysterious “Missing” State
A few months ago, I was working on a Next.js app for my current employer, which involved a real-time dashboard displaying user activity that required real-time data updates. The app used Zustand for state management, and the UI relied heavily on props passed from the store. The feature in question was a dashboard that displayed user activity logs.
At first glance, everything seemed to work. When the user clicked a button, the component re-rendered, and the data appeared correctly. But after a few hours of testing, I noticed a strange issue: the data would occasionally fail to update. The UI would show stale information, and the logs would “freeze” until a page refresh.
I was frustrated. I checked the console for errors, but there were none. Not only that, but I verified that the API calls were being made, and the data was coming back correctly. Then I looked at the Zustand store—everything seemed in order. What was going on?
The Initial Approach: The “Scientific” Method
I tried the traditional debugging steps:
— Check the console logs for errors. Nothing showed up.
— Inspect the Zustand state in the DevTools to confirm data was being updated. It was there.
— Look at the component rendering logic—the props were passing correctly.
— I felt like I was missing something obvious. Why wasn’t the UI updating?
The Breakthrough: A Creative Leap
Frustrated, I decided to step back and think differently. Instead of focusing on the data flow, I started tracing the problem through the DOM.
Using DevTools, I opened the “Elements” panel and inspected the problematic element. I noticed that the component wasn’t re-rendering when it should have been. But why?
I realized that the component was using a `useEffect` hook to fetch data, but the dependency array was incomplete. The effect wasn’t re-running when the store changed because the dependent value (a boolean flag) wasn’t in the array.
Wait—that’s not possible. I’d written the effect like this:
rnrn // jsxrnuseEffect(() => {rn fetchData();rn}, [state]);rn
rnrnBut state was a complex object, and the dependency array didn’t include it. The effect only ran when state changed, but in reality, the store had updated a different part of the state that triggered the UI to change.
This was the root cause: the component wasn’t re-rendering because the effect wasn’t aware of the state change.
The Creative Solution
Instead of just fixing the dependency array, I realized I needed to rethink how the component interacted with the store. I used VS Code’s Debugger to step through the code and track when the state changed. I found that the issue was a cascading effect: changes in one part of the state (e.g., `userActivity`) weren’t propagating correctly to the component.
I adjusted the Zustand reducer to ensure all relevant state fields were updated, and then restructured the component’s dependencies to include the necessary values. Finally, the UI started updating as expected.
The Lesson: Debugging is an Art
This experience taught me that debugging isn’t just about finding syntax errors or typos—it’s about understanding the system. Sometimes, the problem lies in how components interact with data, not in the code itself.
Tools like DevTools (for inspecting DOM and network requests) and VS Code’s Debugger (for stepping through code) are invaluable, but they’re only as helpful as the developer’s ability to use them creatively.
Debugging is an art because:
— It requires intuition to spot patterns that aren’t immediately obvious.
— It demands creativity to rewire a system when it breaks.
— It hinges on context—knowing which part of the codebase to focus on.
Final Thoughts
In the end, the bug wasn’t just a technical issue; it was a lesson in how systems are interconnected. I learned that debugging is as much about why things break as it is about how to fix them.
So next time you’re stuck, take a step back. Use your tools, but don’t be afraid to think outside the code. Sometimes, the solution lies not in the lines of code, but in how they all fit together.
Debugging is an art, not a science.
And that’s why it’s both challenging and rewarding. 🎨💻
Popular posts

Explaining Laravel's Controller
One of the core components of Laravel is the Controller, which plays a vital role in the MVC (Model-View-Controller) architecture.

Digital Marketing Trends to Watch for Now and Beyond
Digital marketing has become an integral part of modern business strategies, and its importance will only continue to grow as we venture into the future.

Why Website Revamping is Important for Your Business
A website that fails to meet your audience's expectations can harm your business and sales, highlighting the importance of website revamping for your business.

The Psychology of Digital Marketing
To be successful in digital marketing, you need to understand the psychology of your target audience and how they behave online.

How to Clear Laravel Cache: A Step-by-Step Guide
During development or after making significant updates, you may need to clear the caches, to see your changes reflected, learn how to clear Laravel cache.

Laravel Error Handling
In this blog post, we'll delve into Laravel error-handling mechanisms and explore how you can effectively manage sand handle errors.